
(February 17, 2012)
Abstract:
Contents
Introduction
We report a morphology-based approach for the automatic identification of outlier neurons, as well as its application to the NeuroMorpho database, with more than 5,000 neurons. Each neuron in a given analysis is represented by a feature vector composed of 20 measurements, which are then projected into a two-dimensional space by applying principal component analysis. Bivariate kernel density estimation is then used to obtain the probability distribution for the group of cells, so that the cells with highest probabilities are understood as archetypes while those with the smallest probabilities are classified as outliers. The potential of the methodology is illustrated with respect to several cases involving uniform cell types as well as cell types for specific animal species. The results provided several insights regarding the distribution of cells, yielding single and multi-variate clusters, as well as suggesting that outlier cells tend to be more planar and tortuous. The proposed methodology can be used in several situations involving one or more categories of cells, as well as for detection of new categories and possible artifacts.
File Information
The software can be downloaded at: matlab_code.zip
The following files are supplied:
| readme.pdf | this file |
| outliers.fig | interface of GUI-version |
| outliers.m | main file of GUI-version |
| initialize.m | routine to initialize the main parameters |
| main.m | main routine to archetype and outliers detection |
| kde2d.m | routine for bivariate kernel estimate (see credits inside) |
| showvar.m | routine to show a specific neuron measurement |
| *.txt | Offline NeuroMorpho database. |
System Requirements
This version requires Matlab (Mathworks Inc, Natick, USA) and allows the user to apply the workflow using a graphical user interface (GUI, Fig. ![[*]](crossref.png) ).
).
The Graphical User Interface (GUI)
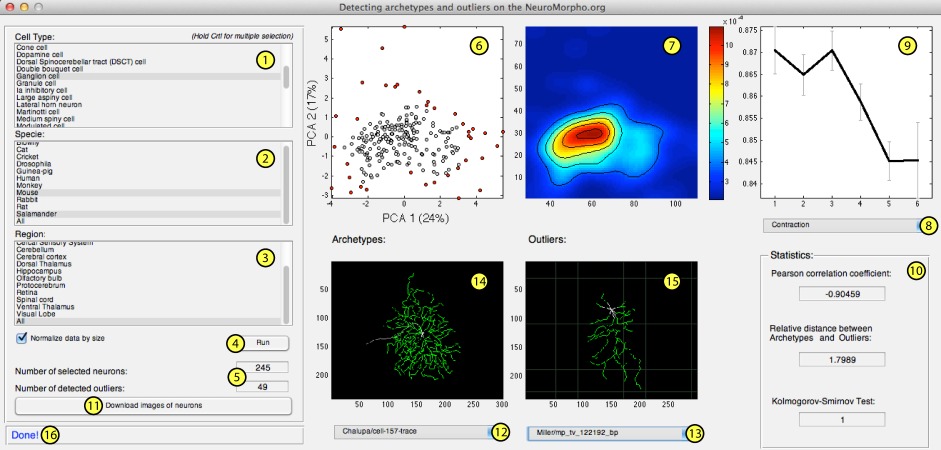
Figure shows the user interface where we featured the main components, which are described bellow:
- List box 1: cell types.
- List box 2: animal specie.
- List box 2: brain region.
- Run button: execute the archetype and outlier detection.
- Text: statistics of the current analyses.
- Graphic: 2D PCA projections where the outliers are shown in red.
- Graphic: estimated probability density function.
- List: list of available measurements.
- Graphic: Average value of the chosen measurement as a function of the region id.
- Text: basic statistics related to the chosen measurement.
- Download button: download the images of archetypes and outliers cells from NeuroMorpho.org.
- List: list with the names of all archetype cells.
- List: list with the names of all outliers cells.
- Graphic: where the image of the chosen archetype cell is shown.
- Graphic: where the image of the chosen outlier cell is shown.
- Text: status bar.
To use the GUI, start up Matlab and set the working directory to that containing the main-file outliers.m, calling the corresponding function outliers().
At this point, the GUI opens and the user must choose a combination of entries in the list boxes (shown by markers 1, 2 and 3 in Figure ), in order to specify the cell types, animal species and brain region, respectively.
Next the user can press the button Run to execute the main code.
Observe that the minimum number of cells required to properly execute the code is twenty.
Otherwise, a warning message is shown in the status bar.
The 2D PCA projection as well as the estimated probability density function are shown in the places featured by the markers 6 and 7 in Figure .
Moreover, a new window is also opened where the user can find the plots of the average values of all measurements as a function of the region id.
In this window, we show in red every measurement whose absolute Pearson correlation coefficient is greater than 0.85.
Additional information about a specific measurement can be obtained by using the list 8 of Figure .
After choosing a measurement, plot 9 is updated and some basic statistics are shown in the field marked 10.
These statistics correspond to the Pearson correlation coefficient between the measurement and the region id, the relative distance between archetypes and outliers, and the boolean results of the Kolmogorov-Smirnov test.
This test returns 0 if the values of the chosen measurement come from the same probability distribution, which means that the differences between archetypes and outliers are not significant.
In the case the values come from different distributions, the test returns 1.
Images corresponding the the archetypes and outliers cells can be downloaded from NeuroMorpho.org.
In order to do so, just press the download button (marker 11 in figure ) and wait for a few minutes for all cells to be downloaded.
The images need to be download only once.
When the downloading is concluded, the lists marked as 12 and 13 are automatically updated with the name of archetypes and outliers.
By choosing a cell from these lists, the neuron image is shown in the plots 14 for archetypes or 15 for outliers.
The bar marked by 16 is used to display the current state of the program as well as specific warning messages.
The user can also disable the normalization by size by unchecking the check box Normalize data by size.
Disclaimer
The software and obtained results are not guaranteed regarding correctness and every application of this software is sole responsibility of the user.